


Fastest Growing Commuting Mode is ‘Working at Home’
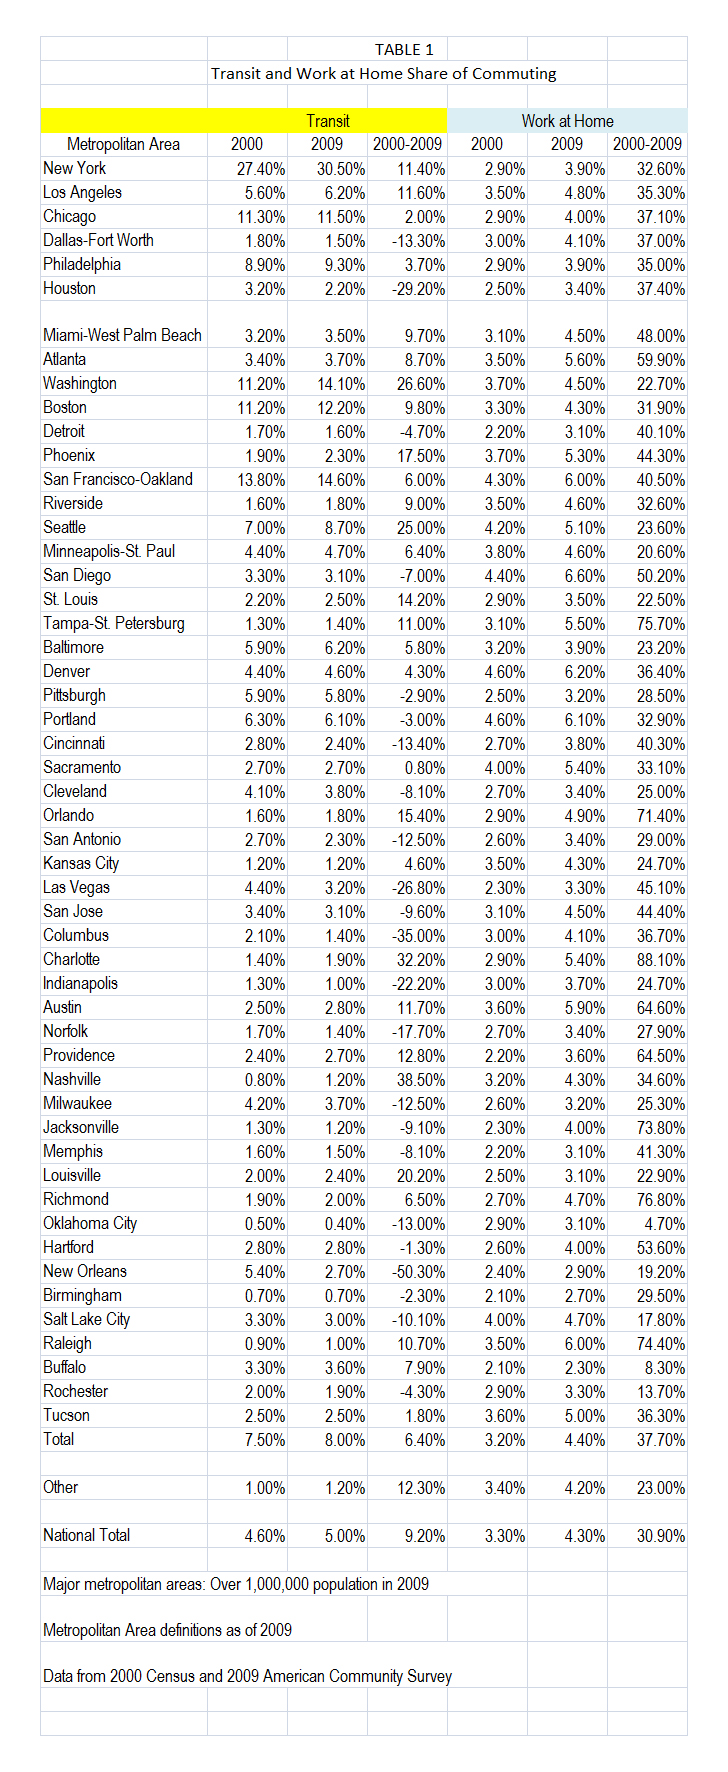
COST Commentary: Telecommuting (working at home) has been the fastest growing commute mode in the US for many years. Wendell Cox provides a ‘work at home’ update in the article below using recently released 2009 American Community Survey Data. As might be expected, the Austin Metropolitan area is one of the top five major US Metro areas in share of commuters ‘working at home,’ shown in table 1, below. Austin’s 5.9% share of commuters ‘working at home’ is more than double the public transit share of commuters. Transit’s share and absolute number of riders has been declining as telecommuting is increasing in Austin’s rapidly growing population. Capital Metro boardings for 1990, twenty years ago, were 1.3 million greater than the boarding projejcted for the current 2011 year budget. And, the current subsidy costs per ride is $4.64 which is more than doluble the 1990 subsidy per ride of $2.00 in today’s dollars.
For the total nation, not considering New York City, telecommuting has surpassed transit commuting. Considering New York, telecommuting is still slightly behind transit for the overall nation but will surpass transit soon at telecommuting’s current growth rate.
As with many rapidly developing and changing trends due to technology, the implications of the growth of telecommuting are not fully understood or considered in transportation planning. Telecommuting is clearly taking more vehicles off roadways than public transit because most telecommuters have automobile alternatives and the majority of public transit commuters do not. Growth in telecommuting is one of the major reasons that automobile travel for commuting is typically less than 20% of the total vehicle miles traveled (VMT) in a metropolitan area.
In Austin, the daily vehicle miles traveled (DVMT) per capita has been on a declining trend for some 10 years due to factors including the Increase in telecommuting and the reduction in the remaining 80% of roadway travel due to locating retail, restaurant, health, entertainment, recreation, education and other facilities in suburbs closer to the people being served. Accompanying these positive driving trends are improving trends in air quality driven primarily by reduced driving per capita and substantial improvements in vehicle engine technology.
COST suggests the continued growth in telecommuting should be considered, encouraged and incentivized as an extremely cost effective way to address Austin mobility needs. Telecommuting is far more cost effective than wasteful spending on ineffective, exorbitantly expensive train transit which is a heavy burden, shouldered by many lower income citizens who do not have alternatives and for all taxpayers who highly subsidize the very few train riders who mostly have alternatives.
Decade of the Telecommute
by Wendell Cox 10/0502010
The rise in telecommuting is the unmistakable message of the just released 2009 American Community Survey data. The technical term is working at home, however the strong growth in this market is likely driven by telecommuting, as people use information technology and communications technology to perform jobs that used to require being in the office.
In 2009, 1.7 million more employees worked at home than in 2000. This represents a 31% increases in market share, from 3.3 percent to 4.3 percent of all employment. Transit also rose, from 4.6% to 5.0%, an increase of 9% (Note). Even so, single occupant automobile commuting also rose, from 75.7% to 76.1%, despite the huge increase in gasoline prices. The one means of transport that continued to decline was car pooling, which saw its share decline from 12.1% in 2000 to 10.0% in 2009.
The increase in working at home was pervasive in scope. The share of employees working at home rose in every major metropolitan area (over 1,000,000 population), with an average increase of 38%. The largest increase was in Charlotte – ironically a metropolitan area with large scale office development in its urban core – with an 88% increase in the work at home market share. In five metropolitan areas, the increase was between 70% and 80% (Richmond, Tampa-St. Petersburg, Raleigh, Jacksonville and Orlando). Only five metropolitan areas experienced market share increases less than 20% (New Orleans, Salt Lake City, Rochester, Buffalo and Oklahoma City). Nonetheless, the rate of increase in the work at home market share exceeded that of transit in 49 of the 52 major metropolitan areas. Transit’s increase was greater only in Washington, Seattle and Nashville (where the transit market share is miniscule).
The working at home market share increase was also strong outside the major metropolitan areas, rising 23%.
Working at home is fast closing the gap with transit. In part driven by the surge in energy prices since earlier in the decade, transit experienced its first increase since data was first collected by the Bureau of the Census in 1960. Yet working at home is growing more rapidly, and closing the gap, from 1.7 million fewer workers than transit in 2000 to only 1.0 million fewer in 2009. At the current rate, more people could be working at home than riding transit by 2017. This is already the case in much of the country outside the New York metropolitan area, which represents a remarkable 39 percent of the nation’s transit commuters. Taking New York out of the picture, 31% more people (1.35 million) worked at home than traveled by transit, more than 4 times the 7% difference in 2000 (Table 1, click for additional information).
CLICK TO ENLARGE
The rise of working at home is illustrated by the number of major metropolitan areas in which it now leads transit in market share. In 2000, working at home had a larger market share than transit in 28 of the present 52 major metropolitan areas. By 2009, working at home led transit in 38 major metropolitan areas, up 10 from 2000. Between 2000 and 2009, the working at home market share increased nearly 6 times as much as the transit share in the major metropolitan areas (38.4% compared to 6.4%).
Working at Home Leaps Above Transit In Portland and Elsewhere: Perhaps most surprising is the fact that Portland now has more people working at home than riding transit to work. This is a significant development. Portland is a model “smart growth” having spent at least $5 billion additional on light rail and bus expansions over the last 25 years. Portland was joined by other metropolitan areas Houston, Miami-West Palm Beach, New Orleans and San Jose, all of which have spent heavily on urban rail systems. Working at home also passed transit in Cincinnati, Hartford, Las Vegas, Raleigh and San Antonio (Table 2).

CLICK TO ENLARGE
Further, the shares are close enough at this point that working at home could surpass n transit in Milwaukee, Cleveland and Minneapolis-St. Paul in the next few years.
Transit: About New York and Downtown
As noted above, transit also has gained during this decade. However, the gains have not been pervasive. Out of the 52 major metropolitan areas, transit gained market share in 29 and lost in 23. As usual, transit was a New York story, as the New York metropolitan area saw its transit work trip market share rise from 27.4% to 30.5%. New York accounted for 47% of the increase in transit use, despite representing only 37% in 2000. New York added nearly 500,000 new transit commuters. This is nearly five times the increase in working at home (106,000). Washington also did well, adding 125,000 transit commuters, followed by Los Angeles at 73,000 and Seattle at 41,000.
Transit’s downtown orientation was evident again. This is illustrated by the fact that more than 90% of the increased use in the major metropolitan areas occurred in those metropolitan areas with the 10 largest downtown areas (New York, Los Angeles, Chicago, Philadelphia, Houston, Atlanta, Washington, Boston, San Francisco and Seattle). Among these, only Houston experienced a decline in transit commuting.
Implications
Working at home has been the fastest growing component of commuting for nearly three decades. In 1980, working at home accounted for just 2.3% of commuting, a figure that has nearly doubled to 4.3% in 2009. This has been accomplished with virtually no public investment. Moreover, this seems to have happened without any loss of productivity. Companies like IBM, Jet Blue and many others have switched large numbers of their employees to working at home. These firms, which necessarily seek to provide the best return on their investment for stockholders and owners would not have made these changes if it had interfered with their productivity.
Over the same period, and despite the recent increases, transit’s market share has fallen from 6.4% of commuting in 1980 to 5.0% in 2009. At the same time, gross spending over the period rose more than $325 billion (inflation and ridership adjusted) from 1980 levels. Inflation adjusted expenditures per passenger mile have more than doubled since that time.
Given the remarkable rise of telecommuting, its low cost and effectiveness as a means to reduce energy use, perhaps it’s time to apply at least some of our public policy attention to working in cyberspace. It presents a great opportunity, perhaps far greater and far more cost-effective than the current emphasis on new rail transit systems.
———-
Note: Work trip market share reflects transit in its strongest market, trips to and from work. Transit’s overall impact, measured by total roadway and transit travel (passenger miles) is approximately 1%, compared to the national work trip market share of 5%.
Wendell Cox is a Visiting Professor, Conservatoire National des Arts et Metiers, Paris and the author of “War on the Dream: How Anti-Sprawl Policy Threatens the Quality of Life”