


YES, Increased Road Capacity CAN Reduce Congestion – Higher Density and Greater Transit Share Increase Congestion
COST Commentary: The article below is filled with additional, data-rich confirmations of many, long-held COST positions relative to transportation and mobility. The article below by Wendell Cox is based on congestion study work conducted by the Texas Transportation Institute (TTI) covering U.S. urban areas over the past 30 years. TTI’s traffic congestion ratings were adopted internationally. INRIX, a Seattle based automobile navigation services company was first, providing virtually the same measure for urban areas in North America and Western Europe. More recently, ‘Tom Tom’, an Amsterdam based automobile navigation services company issued its ‘TomTom’ Traffic Index, providing the most comprehensive international coverage, adding Australia, South Africa and New Zealand.
These analytical, congestion studies and observations throughout the “Higher Income World” provide significant insights into the negative impacts of numerous Austin transportation and land planning policies and approaches which are justified with shallow, unsupported and incorrect, foundation assumptions. Among others, these include:
1. Myth: “There is no point in expanding roadways because they will only be filled up by new traffic.”
Reality: “In fact the TTI data, which measures at the comprehensive urban area level (and the only reliable level), says we can.”
We see an example of this in the Austin region. For many years, Austin did not improve its roadway system to meet the needs of its major growth in population. The TTI travel time index indicated increasing congestion over more than 20 years through 2005. Then, congestion began to decrease as a number of highway improvements were implemented including new roads, expanded roads and new intersections. Major improvements now in process on U.S. 290 East and lesser improvements being implemented on SH 71 East and 290 West will improve East-West traffic. The expansion of MoPac has begun and should provide critically needed relief in this congested north-south corridor. This region continues to grow and further roadway improvements, to “catch-up and keep pace with population, will be needed such as the I-35 expansions being discussed and numerous others.
2. Myth: Higher population density will reduce traffic congestion.
Reality: “The TomTom traffic congestion rankings are further indication of the association between higher population densities and more intense traffic congestion.” Throughout the U.S. and other higher income countries, higher density has a strong correlation with higher congestion. The driving per person may be slightly lower for higher density living, but the higher density of people overwhelms this slight reduction in per capita driving, resulting in greater driving per area and increased congestion.
It is interesting to note the TomTom congestion index ranks Austin as less congested than more extensive U.S. transit cities with bus and rail, including: Los Angeles, San Francisco, Seattle, San Jose, Washington, New York, Portland, Boston, Chicago, Miami, Denver and Houston. Austin is also less congested than all of the major Canadian cities, except Calgary, with their major rail transit.
Following is the partial abstract from a paper referenced in the last paragraph of the paper below: “It is often assumed that lower density cities have longer average work trip travel times and greater traffic congestion than more compact cities. This paper summarizes available data with regard to the association between urban densities and work trip travel times as well as between urban densities and the intensity of traffic congestion. The analysis indicates that higher urban densities are associated with both longer work trip travel times and greater traffic congestion. Because greater access is associated with more favorable urban economic outcomes, a greater focus on access seems advisable.”
3. Myth: Sprawl (lower density living and employment) results in greater congestion.
Reality: “Residents of the United States also benefit because employment is more dispersed, which tends to result in less urban core related traffic congestion. Lower density and employment dispersion are instrumental in the more modest traffic congestion of the United States, including such large urban areas as Dallas-Fort Worth (the fastest growing high income world metropolitan area with more than 5,000,000 population), Houston, Miami and even roadway deficient Atlanta.”
The Austin region has experienced reductions in driving per person over many years as the population and employment have grown rapidly and become more dispersed. This is very contrary to the promotion of most ‘higher density’ and ‘increased transit’ advocates. However, the reality is reasonably simple. Work commuting is less than 20 % of total driving. So, even if some work commutes are longer, the other 80% of driving is reduced because dispersion of living results in dispersion of supporting business, recreation, health care, education, etc. Today, total regional driving increases can be closely related to population growth percentage. An additional and major plus to “dispersion” is it provides higher quality of life for most due to increased affordability of homes.
Summary:
The actual data, created by free citizens’ choices and actions, would indicate public policies resulting in: 1) spending huge, disproportionate amounts of tax dollars on public transit, 2) regulating, promoting and incentivizing developers to build higher density, 3) creating obstacles which increase congestion and other constraints to discourage the convenience of automobile use, and, 4) implementing regulatory constraints to citizens’ choices of achieving their desired and deserved quality of life through “free” selection of affordable housing; are contrary to the greater good of the Austin region and will result in the degradation of citizens’ quality of life and Austin as a world-class city.
_____________________________________________________________________________
NEW ZEALAND HAS WORST TRAFFIC: INTERNATIONAL DATA
by Wendell Cox 11/13/2013 in newgeography.com
Three decades ago, the Texas Transportation Institute (TTI) at Texas A&M University began a ground-breaking project to quantify traffic congestion levels in the larger urban areas of the United States. The Urban Mobility Report project was begun under Tim Lomax and David Shrank, who have led the project over the first 30 annual editions. Perhaps the most important contribution of this work to the state of transportation knowledge is TTI’s “travel time index,” which measures the extent to which peak period traffic congestion as to travel times.
Of Highway Expansion and Maternity Wards
The TTI data has been invaluable. One important contribution has exposed a fallacious interpretation of the “induced traffic” effect, which holds that there is no point in expanding roadways because they will only be filled up by new traffic. As if more maternity wards would increase the birth rate, the argument goes that we “can’t build our way out of congestion.” In fact the TTI data, which measures at the comprehensive urban area level (and the only reliable level), says we can.
I recall a 1980s City Hall meeting with a Portland Commissioner, who admiringly cited Phoenix for not having built a Los Angeles style freeway system. I remarked that if there was anything worse than Los Angeles with its freeways, it would be Los Angeles without its freeways. Then, Phoenix was the 35th largest urban area in the nation, yet had the 10th worst traffic congestion. The situation soon was improved, after Phoenix voters authorized funding for the largest recent freeway expansion program and now Phoenix ranks 37th in traffic congestion, despite having more than doubled in population (now the 12th largest urban area).
The lesson repeated itself in traffic clogged Houston, which led Los Angeles in traffic congestion in three of the first four years of the Annual Mobility Report. Under the leadership of visionary Mayor Robert Lanier, freeway and arterial expansions were built, and Houston dropped to rank 10th in traffic congestion despite having since added more residents than live in Portland. Meanwhile, Portland, with its densification and anti-automobile policies has been vaulted from the 47th worst traffic congestion in 1985 to 6th worst in 2012, which is notable for the an urban area ranking on only 23rd in population.
Houston’s roadway expansions cleared the way for a Los Angeles run of 26 straight years as the nation’s most congested urban area, with little prospect of improvement.
The Travel Time Index Goes International
TTI’s traffic congestion ratings were adopted internationally. INRIX, a Seattle based automobile navigation services company was first, providing virtually the same measure for urban areas in North America and Western Europe. More recently, TomTom, an Amsterdam based automobile navigation services company issued its own TomTom Traffic Index, providing by far the most comprehensive international coverage, adding Australia, South Africa and New Zealand.
TomTom has just produced its results for the second quarter of 2013. Looking globally, Los Angeles does not look so bad; it didn’t even make the top 10 most congested, outpaced (or perhaps better: underpaced) by urban areas in Western Europe and Canada.
Higher Income World Urban Areas
TomTom produced data for 122 urban areas in the higher income United States, Western Europe, Canada, Australia and New Zealand. This included nearly all urban areas with more than 1,000,000 population, and some smaller. It might be expected that the “sprawl” of US urban areas, and their virtual universality of automobile ownership, as well as the paucity of transit ridership in most metropolitan areas would set the US to the nether world of worst traffic congestion. This is not so, and not by a long shot.
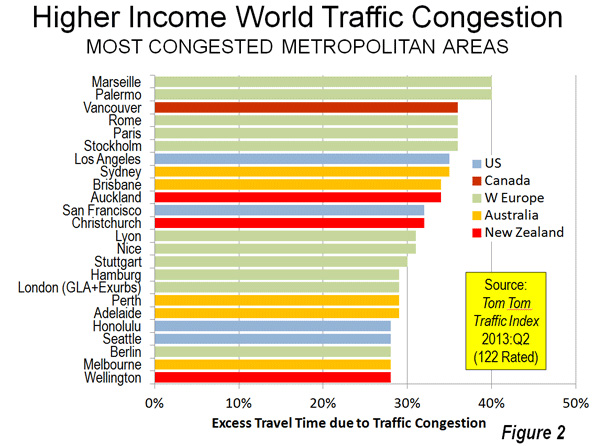
1. New Zealand: The trophy goes to, of all places, New Zealand (Figure 1). The average excess time spent in traffic in the three urban areas of New Zealand rated by Tom Tom was 31.3%. This means that the average trip that would take 30 minutes without congestion would take, on average, approximately 40 minutes in the three urban areas of New Zealand. This is stunning. New Zealand’s urban areas are very small. The largest, Auckland, has a population of approximately 1.3 million, which would rank it no higher than 25th in Western Europe, 35th in the United States and 4th in Canada and Australia. Christchurch and Wellington are among the smallest urban areas (less than 500,000 population) covered in the TomTom Traffic Index, but manage to rank among the 20 most congested (Figure 2). Christchurch has no freeways and Wellington’s are not long.
2. Australia: Second place is claimed by Australia. The average trip takes 27.5 percent longer in Australia because of traffic congestion. All five of Australia’s metropolitan areas with more than 1,000,000 population are among the 20 most congested urban areas in the higher income world. In the case of four urban areas (Sydney, Brisbane, Perth and Adelaide), every larger US urban area has less traffic congestion. Melbourne is the exception, but is still “punching well above its weight,” with worse traffic congestion than larger Chicago, Dallas-Fort Worth, Houston, Toronto, Philadelphia, Miami, Atlanta, Washington, Riverside-San Bernardino and Boston.
3. Canada: Canada is the third most congested, with an excess travel time of 24.8 percent. Vancouver ranks as the third most congested urban area (36 percent excess travel time) in the higher income world, and has displaced Los Angeles as suffering the worst traffic congestion in North America. This is a notable accomplishment, since Los Angeles has more than five times the population, is more dense and only one-third as many of its commuters use transit to get to work. None of the other five largest urban areas in Canada (Toronto, Montréal, Ottawa, Edmonton and Calgary) is rated among the 20 most congested in the higher income world (Figure 3). Toronto is tied for 6th worst in North America with Washington (DC-VA-MD) and San Jose (Figure 4).
4. Western Europe: Fourth position in the congestion sweepstakes is occupied by Western Europe, where the excess travel time averages 22.2 percent. Marseille (France) and Palermo (Italy) are tied with the worst traffic congestion in the higher income world, with excess travel times of 40 percent. Excluding Christchurch and Wellington, Marseille and Palermo are among the smallest urban areas among the most congested 20, though their large and dense historic cores complicate travel patterns. Rome, Paris and Stockholm, all with strong transit commute shares, are tied with Vancouver for the second worst traffic congestion (36 percent excess travel time). Other Western European entries to the most congested 20 rankings are London, Nice and Lyon in France and Stuttgart, Hamburg and Berlin in Germany. Western Europe contributes only 11 of its 54 rated urban areas to the most congested 20 list (the most 20 most congested list includes 24 urban areas because of a five way tie for 19th).
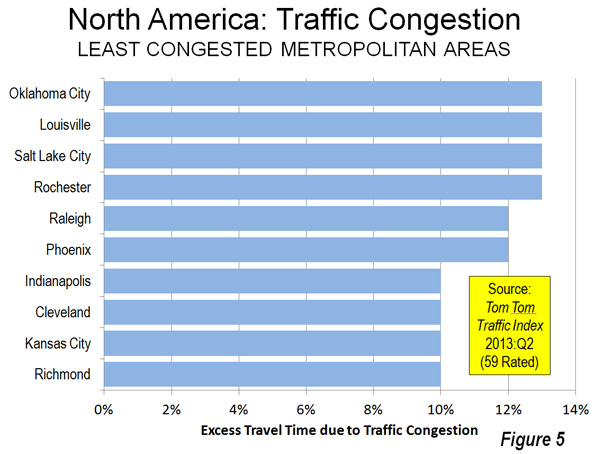
Unlike New Zealand, Australia and Canada, Western Europe has representation in the 20 least congested urban areas (Figure 5), taking seven of the 22 positions (A three way tie at the top places increases the total to 22). The least congested urban area is Zaragoza in Spain (seven percent excess travel time), itself a small urban area of approximately 700,000, while similarly small Bern in Switzerland, Malaga in Spain and Malmo in Sweden are tied with four US urban areas in the second least congested position (10 percent excess travel time).
5. United States: The United States is the least congested in these rankings with an excess travel time of 18.3 percent. Even after losing its top North American ranking to Vancouver, Los Angeles continues to be the most congested urban area in the United States, with an excess travel time of 35 percent. San Francisco (32 percent), Seattle, and much smaller Honolulu (tied at 28 percent) are also in the most congested 20. Only four of the 53 rated US urban areas is in the most congested 20.
The US dominates the least congested 20 list, with 15 urban areas. Richmond, Kansas City, Cleveland and Indianapolis share the second least congested position with three Western European urban areas (10 percent excess travel time). Phoenix, which was formerly one of the most congested in the US, is also on the list, ranking as the 12th least congested in the higher income world and the 5th least congested urban area in North America.
Less Traffic Congestion: Lower Densities and Less Employment Concentration
The TomTom traffic congestion rankings are further indication of the association between higher population densities and more intense traffic congestion. But there is more to the story. Residents of the United States also benefit because employment is more dispersed, which tends to result in less urban core related traffic congestion. Lower density and employment dispersion are instrumental in the more modest traffic congestion of the United States, including such large urban areas as Dallas-Fort Worth (the fastest growing high income world metropolitan area with more than 5,000,000 population), Houston, Miami and even roadway deficient Atlanta.


Wendell Cox is a Visiting Professor, Conservatoire National des Arts et Metiers, Paris and the author of “War on the Dream: How Anti-Sprawl Policy Threatens the Quality of Life.”